Raga AI
ClinicalOps v1 – The First Admin Portal
The first version of ClinicalOps, Raga AI's admin portal for specialty clinics. I built it almost single-handedly in six weeks, from January to February 2026: a dashboard, scheduling, patient intake, insurance validation and verification, claims, fax referrals and settings, for a clinic already running Raga AI's agents. The modules and patterns it proved carried into the monorepo version of ClinicalOps that replaced it.
Introduction
Project description
Before ClinicalOps was a six-app monorepo, it was this: one React admin portal that I built in six weeks for one clinic. Raga AI's agents were already booking appointments, entering intake forms into the clinic's EHR and checking insurance, and staff needed somewhere to see and fix their work.
It started on Google Sheets, where the agents wrote their results, and moved to live APIs one module at a time. The monorepo that replaced it was started in late January, and much of what this portal proved went into it.
- Timeline
- January 9 to February 24, 2026. The monorepo that replaced it was started in late January.
- My role
- Built it: 113 of its 115 commits, covering the design, the frontend and the integrations with Google Sheets and the APIs.
- Team
- A teammate added the Nginx config. The agents and APIs came from Raga AI's backend team.
- Client
- One allergy practice, with the portal running under its brand.
01The problem
Agents doing the work, results in a spreadsheet
By January 2026 Raga AI's agents were doing real work for a clinic: booking appointments by phone, entering new patients' intake forms into the EHR, and checking insurance before visits. Each wrote its results to a Google Sheet.
That worked for engineers, not for front desk staff. They needed answers to three questions without opening a spreadsheet.
Is the visit booked?
Which appointments the agent made, which patients asked to cancel, and where the open slots are.
What did intake miss?
Which fields made it into the EHR, which used a default, and which patients the agent couldn't find.
What will the patient owe?
Whether the patient is covered, and what their benefits mean for the treatment they're about to start.
02The portal
One pattern, eight modules
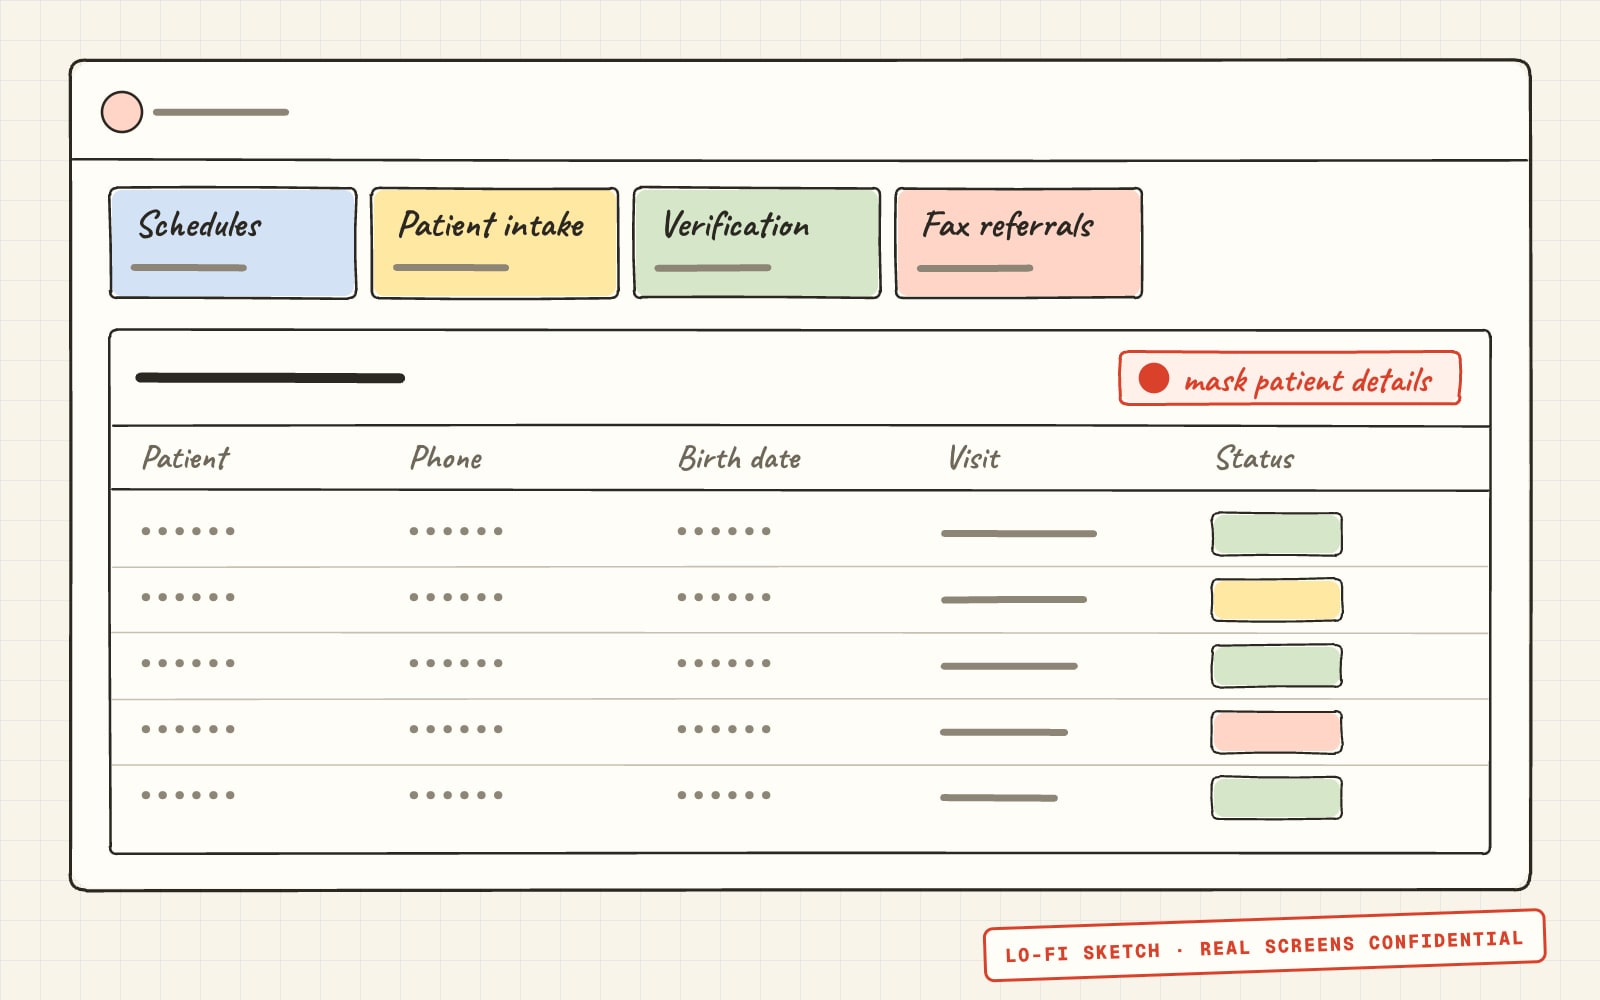
Every module works the same way: counts at the top, a table with search, filters and a PII toggle, a drawer with the details, and an analytics view. Once staff learned one module, they knew them all.
03What I built
The parts I owned
Dashboard
A daily snapshot for the practice: the month's appointments, new patients and follow-ups, hours saved by each module, open and under-used slots, morning and afternoon load, and each provider's utilization.
Scheduling
Appointments booked by the scheduling agent, with cancellation requests highlighted and cancellable from the details drawer, and a slot booking dialog by provider, clinic and visit type.
Patient intake
For each patient, how many registration and health history fields the intake agent entered into the EHR, which used a default and which were skipped, field by field, with failures like "patient not found" flagged.
Insurance validation
Eligibility results for upcoming visits, with eligible, not eligible and error states, whether each result was pushed to the EHR, and a details drawer.
Benefits verification
A page per patient with carrier, plan, coinsurance and copay, deductible and out-of-pocket progress, and a services table that turns benefits into what the patient owes.
- Staff adjust units and reorder services by drag and drop, and the estimate recalculates
- Estimates for rush, cluster and conventional immunotherapy builds
- Save the plan, print it, open the benefits document or email it to the patient
Fax referrals
Referrals that arrive by fax, with booking status, reminders on day 1, 3, 7 and 30, a flag when a person needs to step in, and a document viewer with TIFF support.
Patient details on shared screens
A toggle on every table masks names, phone numbers and birth dates, for screens other people can see.
White-labeling and locked modules
Brand name, logos, colors and type come from environment variables, so the portal can run under each clinic's brand. Modules a clinic hasn't switched on show as locked instead of disappearing.
04Benefits verification
From a benefits check to what the patient owes
The most involved module. For each patient, the benefits the agent found become a plan: deductible and out-of-pocket progress, then a table of services where staff adjust units and order, and see what the patient will owe for each immunotherapy build.
When it's right, staff save the plan, print it, or email it to the patient with the benefits document attached.
05What came next
From one portal to the ClinicalOps monorepo
This portal answered the question of what staff needed. The monorepo that replaced it answered how to build it for many clinics: six apps on one design system, with the same modules rebuilt on a proper foundation.
Sheets to APIs
Reading Google Sheets got the portal working in days. Swapping each module to an API behind the same hooks showed how to keep the UI stable while the backend changed.
One clinic to many
White-labeling through environment variables became per-tenant branding in the monorepo.
Patterns that stayed
Detail drawers, masking patient details and locking modules instead of hiding them all carried over.
06Challenges
The hard parts
Six weeks, one engineer, and data arriving in formats built for people, not software.
A spreadsheet as an API
Each sheet had its own layout, column names written for people, and JSON stored inside cells. The portal normalized the headers and parsed every row into a typed record.
Patient data on shared screens
Front desk screens are seen by patients and visitors. A mask toggle on every table hides names, phone numbers and birth dates.
Estimates staff can trust
Benefits estimates need a person to check them. Staff can change units and order, the cost recalculates after a short pause, and the result is saved for that patient.
Faxes in every format
Referrals arrive as PDFs, images and TIFFs. The document viewer handles each, with download as the fallback.
07Outcome
Where it got to
By late February 2026 the portal covered eight modules, with fax referrals and benefits verification on live APIs. From there, the work moved to the monorepo, where I lead the frontend today.
Engineering notes
- Agents' results read from Google Sheets' query endpoint and parsed into typed records, then swapped module by module for live APIs behind the same hooks
- TanStack Query for data, loading skeletons for every table, and polling notifications for new intake records
- A generic data table with pagination, sorting, row tooltips and date-range filters, reused across modules
- Cost recalculation debounced while staff edit units, with each patient's calculation saved through the API
- Lazy-loaded routes and memoized tables, with an animated logo as the loading fallback
- White-labeling through environment variables, and a per-clinic config for locked modules
- 21 Storybook stories for shared components, and a Docker deploy
Impact
- 113 of the repo's 115 commits, in six weeks
- Eight modules, from scheduling to fax referrals
- Benefits verification with a cost estimate per treatment build
- Patterns that carried into the ClinicalOps monorepo
Looking for a Senior Frontend Engineer who can ship platforms like this?